USPS EDDM CERTIFIED ROUTES · NO LONG-TERM CONTRACTS · 5,000 TO 10,000 ADDRESSES PER CAMPAIGN · SHARED 9x12 POSTCARD · STARTING AT $600 · LIMITED SLOTS PER CAMPAIGN

Direct Mail vs. Digital Advertising for Birmingham Businesses
Compare direct mail, Google Search, and paid social for Birmingham businesses using intent, targeting, costs, attribution, and customer-acquisition economics.

Start With the Business Goal, Not the Channel
There is no universal winner between direct mail, Google Search, and paid social advertising. The correct channel depends on what outcome the business needs, how the target customer makes decisions, and how well the business can track and respond to leads.
Common business goals that drive channel selection include capturing immediate demand from people actively searching for a service, building local awareness in a defined neighborhood, promoting a time-sensitive offer or event, retargeting people who have already visited a website, entering a new service area, and maintaining repeated visibility in a specific geography over time. Each of these goals maps differently to the three channels. A business that needs to capture emergency HVAC calls today has different needs than a dental practice trying to become the familiar name in a new zip code.
This article compares how each channel works, what metrics it produces, when each is likely the strongest fit, and how to evaluate results using the same economics across all three. A reader who concludes that Google Search or paid social is the right first channel for their business should find this article useful and trustworthy.
How the Three Channels Work
TownFavorite Direct Mail
TownFavorite uses a shared-mailer model built on USPS Every Door Direct Mail (EDDM) routes. A physical 9x12 postcard is delivered to every eligible address on a selected carrier route. Multiple local businesses share the cost of a single mailer, which reduces the base mailing cost per household compared to solo direct mail campaigns.
The advertiser selects a market, chooses a product tier, submits creative, and the mailer is delivered to all eligible addresses on the selected route or audience segment. There is no auction. The cost is fixed at booking. The production and mailing cycle requires lead time, typically measured in days to weeks depending on artwork readiness and campaign schedule.
Tracking requires deliberate setup. Because there is no automatic click data, the business must use a unique phone number, QR code, dedicated landing page, coupon code, or CRM source field to connect a response to the mailing. Without a tracking mechanism, attribution is difficult. Results depend on the offer, the creative, the service fit, the timing, and how quickly the business follows up with leads.
Limitations to understand: the mailer is shared, so the advertiser's creative competes for attention with other businesses on the same piece. Route-level EDDM targeting reaches all eligible addresses on a route regardless of individual household behavior or intent. There is no guarantee that a recipient reads or retains the mailpiece. Discarded mail, household mismatch, and delivery variation are real factors.
Google Search Advertising
Google Search ads appear when a user types a keyword into Google. The advertiser bids on keywords, and the platform runs a real-time auction to determine which ads appear and in what order. The advertiser pays per click, not per impression. This means the business only pays when someone actively clicks the ad.
The core advantage of Google Search is active intent. A person searching "emergency plumber Birmingham AL" is expressing an immediate need. Capturing that click puts the business in front of someone who is already in the buying process. Conversion tracking through Google Ads allows the business to measure calls, form submissions, and other conversion actions directly tied to ad spend.
Limitations include search volume constraints. If not enough people are searching for a specific service in a specific area, the available impression volume is low regardless of budget. Cost per click varies by keyword competitiveness, quality score, and market. A landing page that does not convert well will produce clicks without leads. The business must be able to follow up quickly, because high-intent searchers often contact multiple providers.
Facebook and Instagram Advertising
Facebook and Instagram ads operate on an interruption model. The platform shows ads to users based on demographic, behavioral, and interest targeting while they are scrolling their feed, not while they are actively searching for a service. The advertiser pays for impressions or clicks depending on the campaign objective.
Paid social is well suited for visual offers, audience discovery, retargeting website visitors, event promotion, new product awareness, and creative testing. Lead forms built into the platform allow users to submit contact information without leaving the app. Video and demonstration content performs particularly well in this environment.
Limitations include audience fatigue. Showing the same creative to the same audience repeatedly reduces effectiveness over time, requiring ongoing creative refresh. Attribution is more complex than Google Search because the platform uses its own attribution window and pixel-based tracking, which can overlap with other channels. iOS privacy changes have reduced the precision of pixel-based tracking for some audience segments. A user who sees a Facebook ad and later searches Google to find the business may be credited to Google Search in one system and to Facebook in another, creating double-counting risk if not managed carefully.
Why the Metrics Are Not Directly Comparable
Each channel produces different metrics that measure different stages of the customer journey. Comparing them directly as if they measure the same event produces misleading conclusions.
| Metric | What It Measures | Channel |
|---|---|---|
| Households mailed | Eligible addresses that received the physical piece | Direct mail |
| Cost per household mailed | Total investment divided by addresses mailed | Direct mail |
| Tracked responses | Inbound contacts attributed to the mailing via a tracking mechanism | Direct mail |
| Impressions | Number of times an ad was displayed | Google, Meta |
| CPM | Cost per 1,000 impressions | Google, Meta |
| Clicks | Number of times a user clicked the ad | Google, Meta |
| CTR | Clicks divided by impressions | Google, Meta |
| CPC | Total spend divided by clicks | Google, Meta |
| Conversion actions | Defined actions completed after clicking (calls, forms, purchases) | Google, Meta |
| CPL | Total spend divided by qualified leads | All channels |
| CAC | Total investment divided by acquired customers | All channels |
| ROAS | Attributable revenue divided by media spend | All channels |
| ROI | Net attributable return divided by total investment, multiplied by 100 | All channels |
Cost per household is not the same as cost per impression. Cost per impression is not the same as cost per click. A click is not the same as a response. A response is not necessarily a qualified lead. A lead is not necessarily a customer. A direct-mail response rate and a digital click-through rate measure different events at different stages of the funnel and cannot be placed in the same comparison row as equivalent figures.
Reach does not guarantee attention. Mailing an eligible address does not guarantee that the recipient reads or retains the mailpiece. An impression does not guarantee that the user noticed the ad. These are real limitations that apply to all three channels.
Current TownFavorite Direct-Mail Costs
TownFavorite offers three products with different price points, household reach, and audience strategies. All three use the same 9x12 shared postcard format with 16 total ad positions (8 per side).
| Product | Base Price | Household Reach | Cost per Household |
|---|---|---|---|
| Community Reach | $600 | 5,000 | 10 cents |
| Maximum Reach | $850 | 10,000 | 7.5 cents |
| Elite Targeted Reach | $900 | 2,500 targeted | 36 cents |
The base mailing cost is not necessarily the entire campaign investment. Design, call tracking, a dedicated landing page, discount offers, and follow-up costs may add to the total investment. Household reach is not a prediction of response. The number of households mailed is the starting point for calculating cost per household, not a measure of how many customers will be acquired.
The products differ by price, household reach, audience strategy, and cost per household. They do not differ by physical ad-position count. See the full pricing page for current availability and market details.
When Google Search Is Often the Strongest Fit
Google Search tends to be the strongest fit when the business depends on capturing immediate, active demand. If people in the service area are actively searching for the type of service the business provides, and the search volume is sufficient to generate meaningful impressions, paid search can connect the business directly with buyers who are ready to act.
Conditions that favor Google Search include services with urgent or time-sensitive demand such as plumbing, HVAC repair, or emergency restoration. It also fits businesses with strong landing pages that convert visitors into leads, businesses that can follow up with inbound contacts quickly, and situations where measurable cost per lead and cost per acquisition data is needed to justify the spend.
Google Search is not universally expensive. Cost per click varies significantly by keyword, competition level, quality score, and market. A business with a high-quality landing page and strong conversion rate may achieve a lower customer acquisition cost through search than through other channels. The right evaluation is not the cost per click in isolation but the cost per acquired customer relative to the contribution profit that customer generates.
Google Search is less effective when local search volume is too low to generate meaningful traffic, when the business cannot follow up quickly with inbound leads, or when the goal is building awareness rather than capturing existing demand.
When Paid Social Is Often the Strongest Fit
Paid social on Facebook and Instagram tends to be the strongest fit for businesses with visual offers, businesses that need to build awareness before demand exists, and businesses that want to retarget people who have already shown interest.
Conditions that favor paid social include promoting a visual product or service where images or video communicate the offer clearly, running creative tests to identify which messaging resonates with a target audience, retargeting website visitors who did not convert on the first visit, promoting events or time-sensitive offers to a defined audience, and reaching people who are not actively searching but fit the demographic or behavioral profile of a likely customer.
Lead forms built into the platform allow users to submit contact information without leaving the app, which can reduce friction for certain offer types. Video content that demonstrates a service or product can perform particularly well in the feed environment.
Paid social is less effective when the audience is too narrow for the platform to optimize delivery, when creative fatigue sets in without regular refresh, or when attribution complexity makes it difficult to connect ad spend to actual customer acquisition. Platform-reported results should be reconciled with CRM data to avoid counting the same customer acquisition twice across channels.
When Direct Mail Is Often the Strongest Fit
Direct mail through TownFavorite tends to be the strongest fit for businesses serving a defined local geography where neighborhood awareness and repeated visibility matter. It is particularly well suited for businesses whose target customers are not necessarily searching online today but will need the service at some point, and for businesses that can track offline responses.
Conditions that favor direct mail include services where the customer relationship is local and geography-specific such as landscaping, home services, dental practices, restaurants, and neighborhood retail. It also fits businesses that benefit from being the familiar name when a need arises, businesses that can offer a trackable incentive such as a QR code or unique phone number, and businesses with a longer sales cycle where repeated exposure builds recognition over time.
Direct mail also fits situations where digital search volume is too low to support a viable paid search campaign, or where the business wants to reach households that have not yet expressed intent but are within the service area.
Limitations that apply to direct mail include shared creative space on the mailer, production lead time before delivery, route-level rather than individual behavior targeting for broad EDDM products, the requirement to set up tracking mechanisms to measure response, the absence of automatic click data, and no guarantee that a recipient reads the mailpiece. Results depend on the offer, the creative, the service fit, the timing, and the speed of follow-up.
A Fair Channel-Comparison Framework
The table below compares the three channels by common business conditions using qualitative labels. These are planning considerations, not guarantees. Actual performance depends on execution, market conditions, offer quality, and tracking capability.
| Business Condition | Direct Mail | Google Search | Paid Social |
|---|---|---|---|
| Capturing urgent intent | Limited fit | Strong fit | Possible fit |
| Building neighborhood awareness | Strong fit | Limited fit | Possible fit |
| Fast campaign launch | Limited fit | Strong fit | Strong fit |
| Creative testing | Limited fit | Possible fit | Strong fit |
| Geographic saturation | Strong fit | Possible fit | Possible fit |
| Retargeting known prospects | Limited fit | Possible fit | Strong fit |
| Offline audience exposure | Strong fit | Limited fit | Limited fit |
| Precise conversion tracking | Possible fit | Strong fit | Possible fit |
| Long sales cycle | Strong fit | Possible fit | Possible fit |
| Limited search volume | Strong fit | Limited fit | Possible fit |
| Visual offer or product | Possible fit | Limited fit | Strong fit |
| Repeated local visibility | Strong fit | Limited fit | Possible fit |
Compare Customer Economics, Not Surface Metrics
The only fair way to compare channels is to measure the same outcome across all three: how many customers were acquired, what it cost to acquire each one, and whether the contribution profit from those customers exceeded the investment. Surface metrics such as cost per click, cost per household, or click-through rate cannot answer that question on their own.
Use the following framework to evaluate any channel after running a campaign. Fill in your actual results. Do not use industry averages as a substitute for your own data.
| Input | Direct Mail | Google Search | Paid Social |
|---|---|---|---|
| Total campaign investment ($) | |||
| Tracked responses or leads | |||
| Qualified leads | |||
| Acquired customers | |||
| Customer acquisition cost (investment / customers) | |||
| Contribution profit per customer ($) | |||
| Total attributable contribution profit ($) | |||
| Net attributable return (profit minus investment) | |||
| ROI (net return / investment x 100) | |||
| Attribution window used |
Revenue and profit are not the same number. Do not use ROAS and ROI interchangeably. ROAS measures attributable revenue divided by media spend. ROI measures net attributable return, which requires subtracting costs, divided by total investment. A campaign can show a positive ROAS and a negative ROI if the contribution margin is low.
Tracking and Attribution by Channel
Direct-Mail Tracking
Direct mail does not produce automatic click data. Tracking requires deliberate setup before the mailing goes out. Common methods include a unique phone number that routes calls from the mailing to a trackable line, a QR code that links to a dedicated landing page, a coupon or offer code that the customer presents or mentions at contact, a CRM source field that records how the customer heard about the business, and a defined attribution window that specifies how long after the mailing a response will be credited to the campaign. Asking "how did you hear about us?" at the point of contact is a low-cost supplement to more structured tracking.
Google Ads Tracking
Google Ads provides conversion tracking through the Google Ads platform. Conversion actions can include phone calls from ads, form submissions on a landing page, purchases, and offline conversions imported from a CRM. Call tracking through Google forwarding numbers or a third-party call tracking service connects phone leads to specific keywords and campaigns. Reconciling Google Ads conversion data with CRM records helps identify which leads actually became customers and at what cost.
Meta Ads Tracking
Meta Ads tracking relies on the Meta Pixel or Conversions API installed on the advertiser's website, lead forms built into the platform, and landing-page conversion events. The platform uses a default attribution window that may differ from the attribution window used by other channels. iOS privacy changes have reduced the precision of pixel-based tracking for some audience segments. CRM matching, where contact information from Meta leads is matched against actual customer records, helps verify which platform-reported leads became paying customers. Attribution-window overlap between Meta and other channels is a real risk. A customer who saw a Facebook ad and later searched Google may be credited to both channels if each platform uses its own last-click or view-through attribution model.
How to Combine Direct Mail and Digital Without Double-Counting Results
Direct mail and digital advertising can work together across different stages of the customer journey. A common sequence is that a direct-mail piece creates local awareness and delivers a specific offer to a defined geographic area. Some recipients visit the website after receiving the mailer. Paid social retargeting then shows ads to those website visitors, reinforcing the offer. Google Search captures people who later search for the service by name or category after seeing the mail or the retargeting ad.
A consistent landing page with a clear CRM source system is necessary to connect these touchpoints without double-counting. If the same customer is attributed to both the direct-mail campaign and the Google Search campaign, the total customer acquisition cost across both channels will appear lower than it actually is. Define attribution windows and source fields before running multiple channels simultaneously.
Do not assume that combining channels multiplies results by a fixed factor. The actual outcome depends on offer consistency, audience overlap, timing, and the quality of follow-up at each stage.
How to Choose a Birmingham-Metro Market
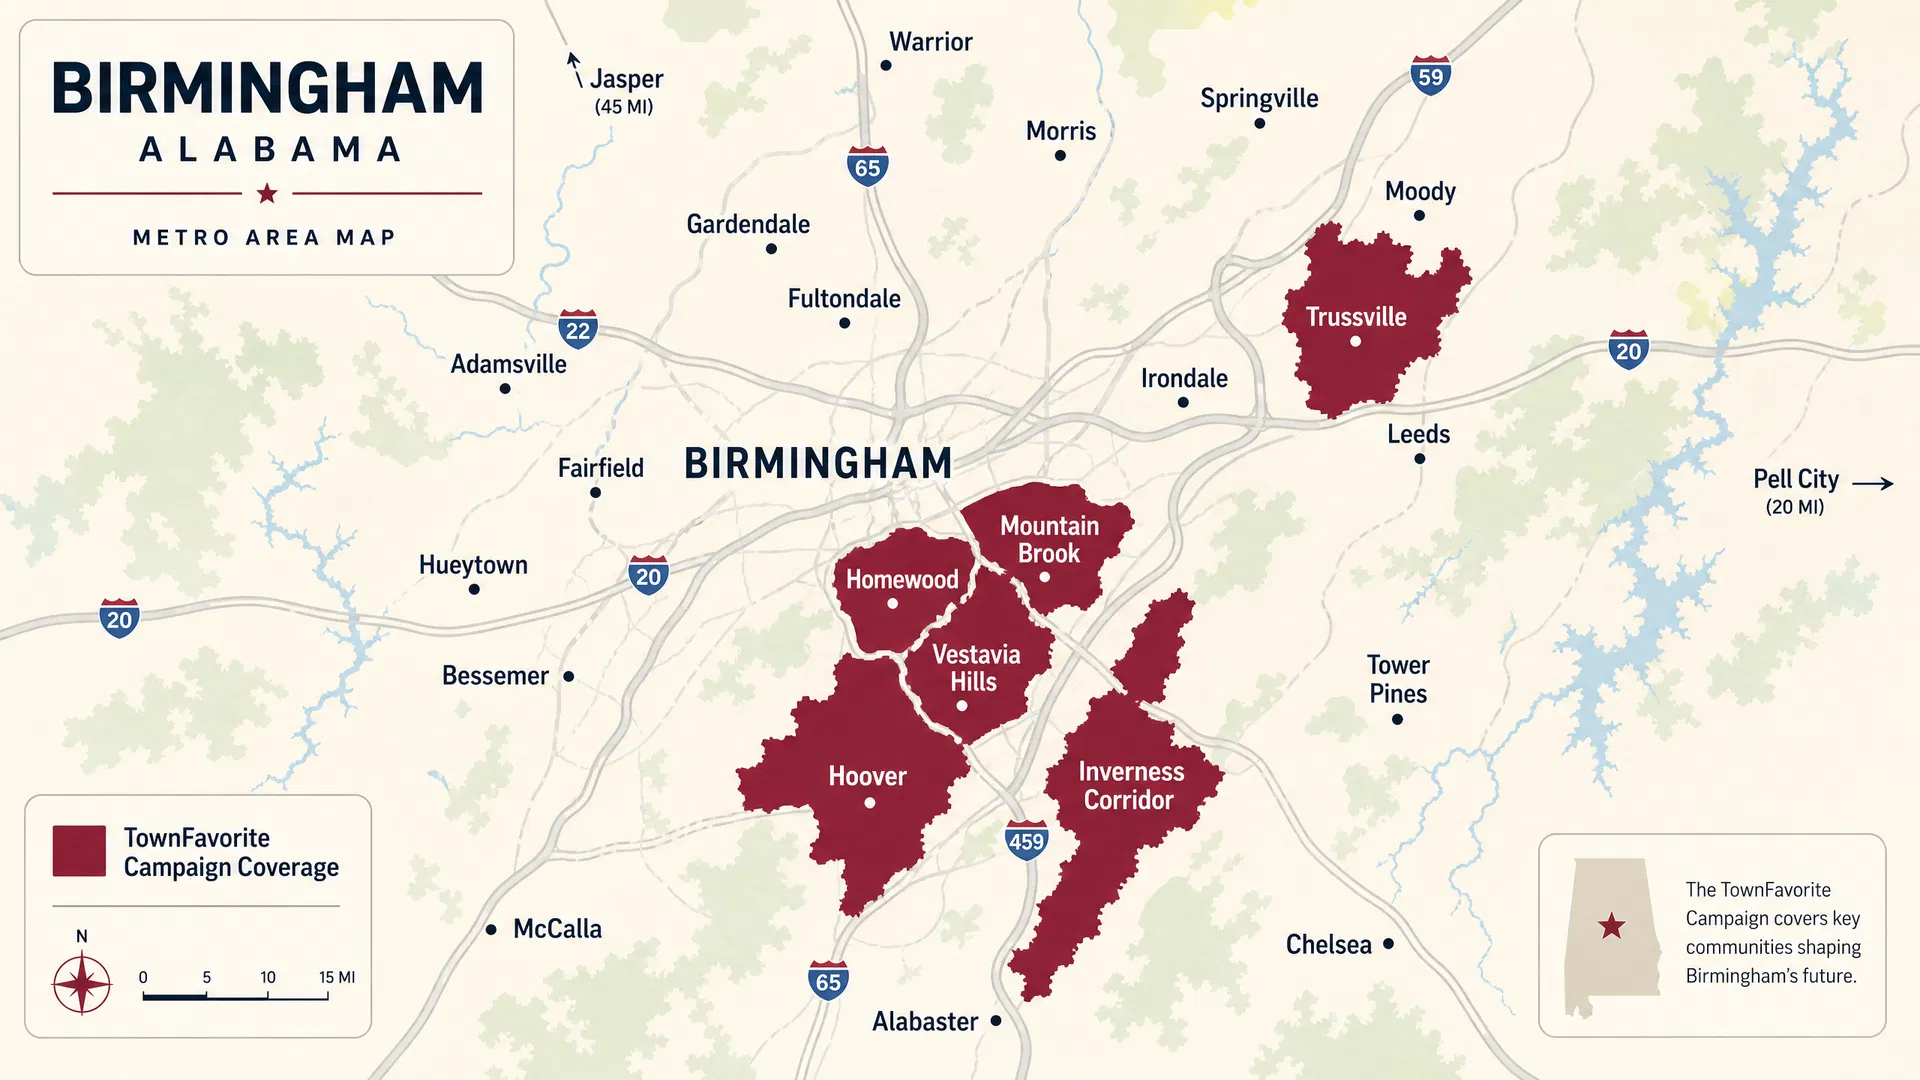
The Birmingham metro contains separate municipalities and independent communities, not a single unified city. Hoover, Homewood, Mountain Brook, Vestavia Hills, and Trussville are separate cities with their own governments, zip codes, and demographics. Referring to them as Birmingham neighborhoods is inaccurate.
Selecting a market for a direct-mail campaign should be based on practical factors rather than income rankings or assumed response rates. Relevant factors include whether the market is within the business's actual service area and travel range, whether the business already has customers or brand recognition in that area, the average transaction value and contribution profit for customers in that area, the size of the route or market relative to the campaign budget, the seasonality of the service in that geography, and whether the business has the capacity to respond to leads generated from that market.
Do not select a market based on income alone. Income is one demographic variable among many. A higher-income market does not guarantee a higher response rate or a lower customer acquisition cost. The fit between the offer, the audience, and the business's ability to serve that area matters more than any single demographic indicator.
Browse current available markets and campaign schedules at Cities.
A Practical Decision Matrix
Use the following as a planning framework, not a guarantee of results. Actual channel performance depends on execution, market conditions, offer quality, and tracking capability.
Choose Google Search first when the business depends on immediate active demand, sufficient search volume exists for the relevant keywords, the business has a landing page that converts visitors into leads, and the team can follow up with inbound contacts quickly.
Choose paid social first when the offer is visual and benefits from image or video creative, the business needs audience discovery or creative testing, retargeting website visitors is a priority, or the goal is event promotion or new product awareness.
Choose direct mail first when the service area is geographically defined and neighborhood awareness matters, the business benefits from repeated local visibility, the business can set up tracking mechanisms to measure offline responses, and the target audience is not necessarily searching online today.
Use a blended approach when the business can track cross-channel response without double-counting, the budget supports multiple touchpoints, and the channels serve distinct funnel roles such as awareness, intent capture, and retargeting.
Questions to Answer Before Allocating the Budget
Before committing budget to any channel, answer the following questions with actual data from the business, not industry averages.
- What business outcome are we buying: leads, customers, awareness, or repeat visits?
- Is the target audience actively searching for this service right now?
- What is one acquired customer worth in contribution profit, not revenue?
- How many customers are needed to break even on the campaign investment?
- What geographic area can the business serve profitably given travel time and capacity?
- Can the team track calls, form submissions, coupon codes, and CRM source fields?
- How quickly can the team follow up with inbound leads?
- How long is the typical sales cycle from first contact to closed customer?
- How will the business avoid double-counting customers across channels?
- When will the campaign be evaluated, and what result would justify a repeat?
Next Steps
If you are evaluating direct mail as part of your local advertising strategy, the following resources provide more detail on TownFavorite's products, economics, and current markets.
- Compare TownFavorite products and pricing
- Calculate campaign economics with your own numbers
- Browse current campaign markets
- How community postcard mailers work: costs, reach, and process
- How to calculate direct-mail ROI for your small business
- Contact TownFavorite
Sources and Methodology
The following sources were used to describe channel mechanics and metric definitions in this article. No platform-average cost, click-through rate, response rate, or customer acquisition cost benchmark is presented as a guaranteed result. Actual results vary by offer, market, audience, creative, landing page, follow-up speed, timing, attribution method, and competitive environment. This article compares channel characteristics and measurement methods, not guaranteed outcomes.
- USPS Every Door Direct Mail program documentation: usps.com/business/every-door-direct-mail.htm (verified July 2026)
- Google Ads metric definitions (impressions, clicks, CTR, CPC, conversions, conversion value): support.google.com/google-ads (verified July 2026)
- Meta Ads metric definitions (reach, impressions, link clicks, leads, attribution windows): facebook.com/business/help (verified July 2026)
- TownFavorite product pricing and reach: current implementation verified at /pricing (July 2026)
More from the Blog
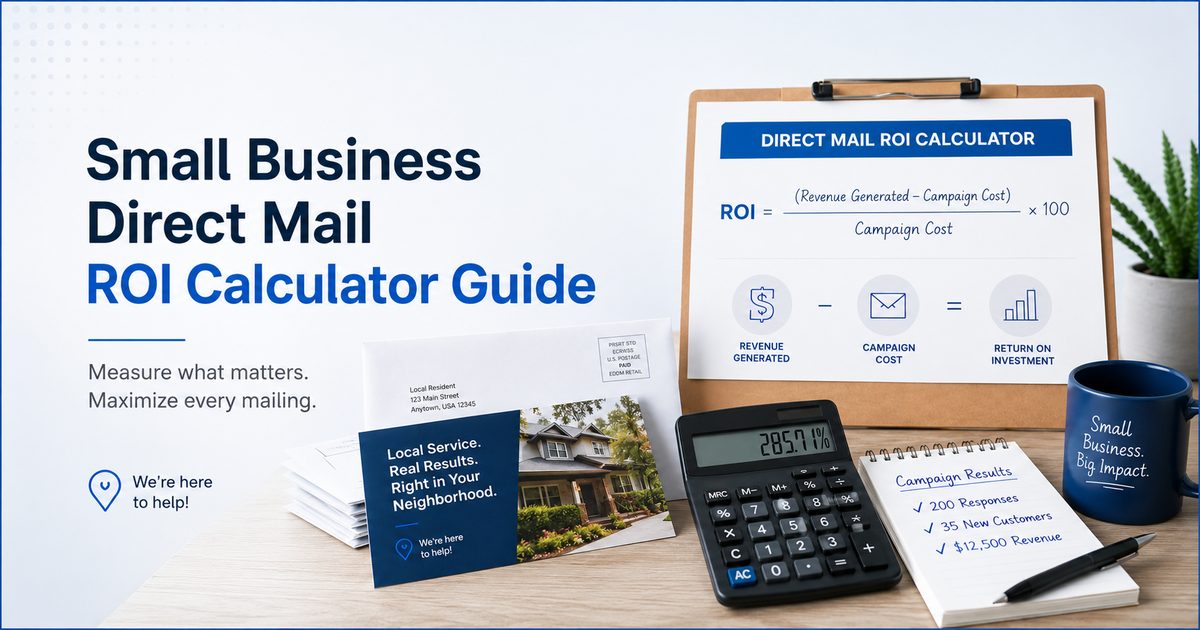
How to Calculate Direct Mail ROI for Your Small Business
Learn how to calculate direct-mail ROI using campaign cost, tracked customers, contribution margin, and break-even analysis, with transparent hypothetical examples.
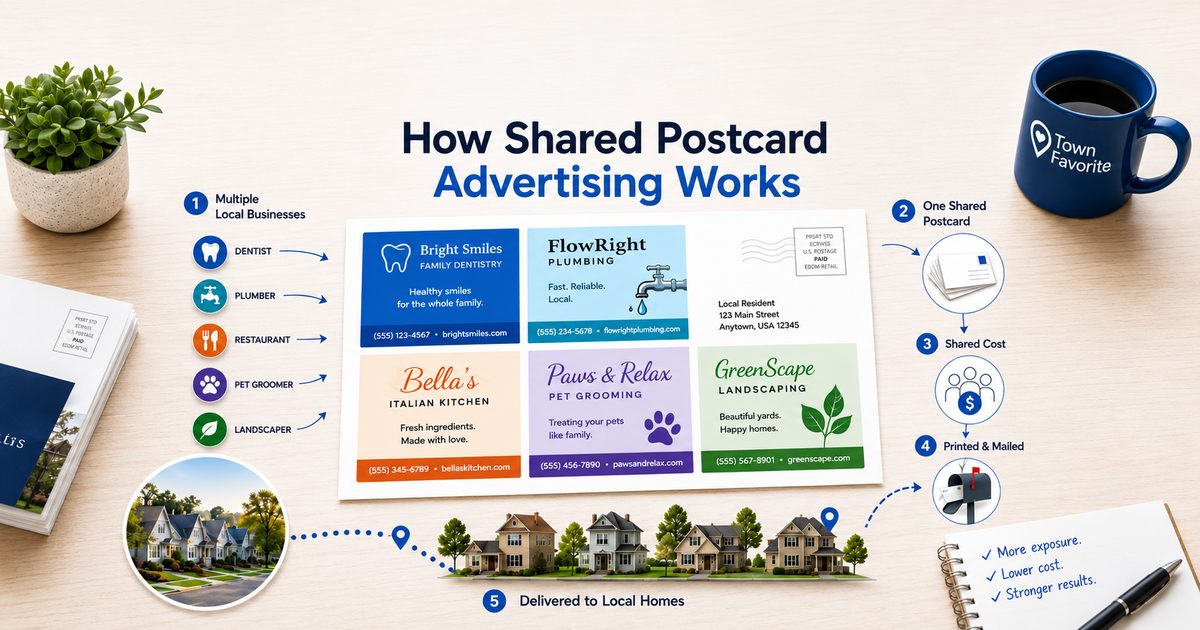
How Community Postcard Mailers Work: Costs, Reach, and Process
TownFavorite community postcard mailers let local businesses share a 9x12 USPS EDDM postcard. Three products. Community Reach ($600/5K homes), Maximum Reach ($850/10K homes), and Elite Targeted Reach ($900/2.5K targeted homes). cover different coverage and demographic goals.

Direct Mail Advertising in Calera, AL
Reach 2,800+ Calera households with a shared 9x12 postcard campaign. Calera is a rapidly growing I-65 corridor city in Shelby County with strong demand for home services and local retail.
Get notified when new campaigns launch
Join our mailing list for direct mail campaign updates, pricing, and availability across the Birmingham metro.
No spam. Unsubscribe anytime.