USPS EDDM CERTIFIED ROUTES · NO LONG-TERM CONTRACTS · 5,000 TO 10,000 ADDRESSES PER CAMPAIGN · SHARED 9x12 POSTCARD · STARTING AT $600 · LIMITED SLOTS PER CAMPAIGN

How to Calculate Direct Mail ROI for Your Small Business
Learn how to calculate direct-mail ROI using campaign cost, tracked customers, contribution margin, and break-even analysis, with transparent hypothetical examples.
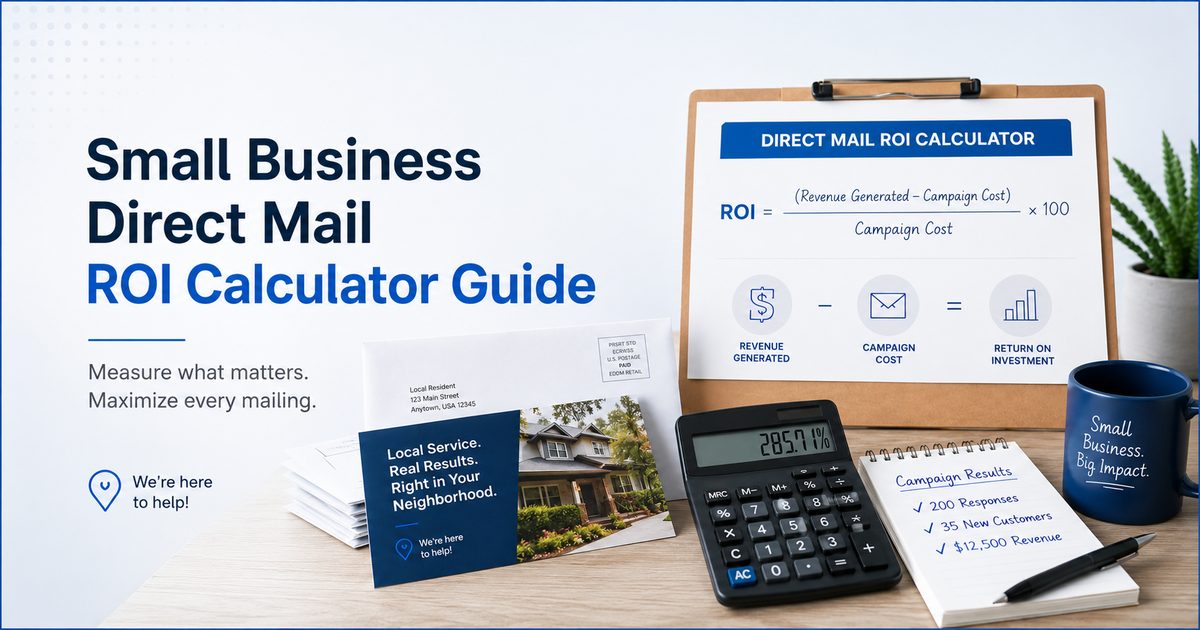
What Direct Mail ROI Actually Measures
Revenue, gross profit, contribution profit, ROAS, and ROI are four different numbers. Using them interchangeably produces incorrect conclusions and can make a losing campaign look profitable or a profitable campaign look weak.
| Term | Definition | Formula |
|---|---|---|
| Revenue | Total attributable sales during the measurement window | Acquired customers x revenue per customer |
| Gross profit | Revenue minus the direct cost of delivering the product or service | Revenue - cost of goods sold |
| Contribution profit | Revenue minus variable costs directly tied to those sales | Revenue - variable costs per sale |
| ROAS | Revenue generated per dollar of media spend | Attributable revenue / media spend |
| ROI | Net profit returned per dollar of total campaign investment | (Net attributable profit / total investment) x 100 |
| CAC | Total campaign cost divided by customers acquired | Total investment / acquired customers |
| LTV | Estimated contribution profit from a customer over a defined period | Contribution profit per period x retention periods |
ROI is a profit-based metric. A campaign that generates $5,000 in revenue on a $600 spend has a 10x ROAS, but if the cost of delivering that $5,000 in service is $4,200, the contribution profit is only $800, and the actual ROI is 60%, not 900%. The distinction matters before you decide whether to run the campaign again.
The Numbers You Need Before Calculating ROI
Accurate ROI requires seven inputs. Missing any one of them forces you to substitute an assumption, and assumptions compound errors.
| Input | What It Represents | Where to Get It |
|---|---|---|
| Total campaign investment | All costs associated with the campaign | Invoices: mailing product, design, tracking, offer discounts |
| Household reach | Number of households the mailer was delivered to | Product specification (fixed per product) |
| Tracked responses | Contacts who responded through a tracked channel | Call tracking, UTM reports, coupon redemptions, CRM source field |
| Acquired customers | Responses that converted to paying customers | CRM or POS records within the attribution window |
| Revenue per customer | Average revenue from each acquired customer during the measurement period | POS or invoicing system |
| Contribution margin | Percentage of revenue remaining after variable costs | Your accounting records |
| Attribution window | The time period you are measuring | Your decision, stated explicitly |
Total campaign investment is not just the base mailing cost. It includes every dollar spent to run the campaign:
Total campaign investment = base mailing product cost + optional design cost + tracking cost + landing-page cost + offer or discount cost + other campaign-specific expenses
The Direct Mail ROI Formula
The correct ROI formula uses contribution profit, not revenue. Using revenue overstates the return because it ignores the cost of delivering the product or service.
Attributable contribution profit = acquired customers x contribution profit per customer
Net attributable return = attributable contribution profit - total campaign investment
ROI (%) = (net attributable return / total campaign investment) x 100
ROAS is calculated differently and answers a different question:
ROAS = attributable revenue / media spend
Customer acquisition cost measures efficiency:
CAC = total campaign investment / acquired customers
None of these formulas requires an assumed response rate. They require measured inputs from your actual campaign results.
Calculate Your Break-Even Point First
Before running a campaign, calculate how many customers you need to cover your total investment. This is the break-even threshold. Any customers above that number generate positive ROI.
Break-even customers = total campaign investment / contribution profit per acquired customer
Round up to the next whole customer. You cannot acquire a fraction of a customer.
If you want to work backward from a response rate, you need two additional steps:
Break-even leads = break-even customers / lead-to-customer close rate
Break-even response rate = break-even leads / households reached
Both the close rate and the response rate in these formulas are your planning assumptions, not industry benchmarks. They should come from your own sales records or be stated explicitly as hypothetical inputs.
Current TownFavorite Product Costs and Reach
TownFavorite offers three mailing products. They differ by price, household reach, audience strategy, and cost per household. The physical mailer is a shared 9x12 postcard with 16 total ad positions (8 per side) across all three products.
| Product | Base Cost | Household Reach | Cost per Household | Audience Strategy |
|---|---|---|---|---|
| Community Reach | $600 | 5,000 | 10 cents | Broad neighborhood saturation |
| Maximum Reach | $850 | 10,000 | 7.5 cents | Maximum market saturation at lowest CPH |
| Elite Targeted Reach | $900 | 2,500 targeted | 36 cents | Precision targeting of high-value households |
Three important clarifications about this table:
- Base product cost does not equal total campaign investment. Design, tracking, offer discounts, and other expenses increase the total.
- Household reach is a delivery count, not a response prediction. How many households respond depends on your offer, creative, audience fit, and other factors outside the product specification.
- Elite Targeted Reach reaches fewer households at a higher cost per household because it targets a defined demographic segment rather than a broad geographic route.
View current availability and pricing at TownFavorite Pricing.
A Transparent Hypothetical Example
Hypothetical example for instructional purposes only. All inputs are user-selected assumptions, not performance predictions.
A home services business selects the Community Reach product. They have tracked their sales process and know their numbers from past campaigns.
| Input | Value | Source |
|---|---|---|
| Product selected | Community Reach | User selection |
| Base mailing cost | $600 | Product price |
| Design cost | $100 | User assumption |
| Tracking cost (call tracking) | $30 | User assumption |
| Total campaign investment | $630 | $600 + $100 + $30 |
| Households reached | 5,000 | Product specification |
| Revenue per acquired customer | $800 | User's own sales records |
| Contribution margin | 50% | User's own accounting |
| Contribution profit per customer | $400 | $800 x 50% |
| Measurement window | 90 days | User decision |
Break-even calculation:
Break-even customers = $630 / $400 = 1.575, rounded up to 2 customers
If this business acquires 5 customers within the 90-day window:
Attributable contribution profit = 5 x $400 = $2,000
Net attributable return = $2,000 - $630 = $1,370
ROI = ($1,370 / $630) x 100 = 217%
CAC = $630 / 5 = $126
If this business acquires 2 customers:
Attributable contribution profit = 2 x $400 = $800
Net attributable return = $800 - $630 = $170
ROI = ($170 / $630) x 100 = 27%
CAC = $630 / 2 = $315
These are two different outcomes from the same campaign. Neither is labeled as expected or probable. The math shows what happens at different customer counts. Your actual result depends on your offer, creative, audience fit, sales process, and tracking.
Four Possible Outcome Scenarios
Hypothetical scenarios for instructional purposes only. None of these scenarios is labeled as typical, expected, or probable.
Using the same hypothetical inputs above (Community Reach, $630 total investment, $400 contribution profit per customer):
| Scenario | Acquired Customers | Contribution Profit | Net Return | ROI | CAC |
|---|---|---|---|---|---|
| Zero customers | 0 | $0 | -$630 | -100% | N/A |
| Below break-even | 1 | $400 | -$230 | -37% | $630 |
| Break-even threshold reached | 2 | $800 | +$170 | +27% | $315 |
| Above break-even | 5 | $2,000 | +$1,370 | +217% | $126 |
The mathematical break-even point in this hypothetical example is 1.575 customers. Because customers cannot be fractional, two acquired customers is the minimum whole-customer count needed to recover the modeled $630 campaign investment.
The purpose of this table is to show how outcomes change with customer count, not to predict which scenario you will experience. The break-even threshold is the number that matters before you run the campaign. Everything above it is positive ROI territory.
Break-Even Customers by Product and Contribution Profit
Base mailing cost only. Design, tracking, offer discounts, and other expenses are excluded. All contribution profit values are examples, not industry benchmarks.
| Product | Base Cost | At $250 Contribution Profit | At $600 Contribution Profit | At $1,000 Contribution Profit |
|---|---|---|---|---|
| Community Reach | $600 | 2 customers | 1 customer | 1 customer |
| Maximum Reach | $850 | 3 customers | 2 customers | 1 customer |
| Elite Targeted Reach | $900 | 4 customers | 2 customers | 1 customer |
This table uses base mailing cost only. If your total campaign investment is higher due to design or tracking costs, recalculate using your actual total investment.
How to Track Direct-Mail Responses
ROI calculations are only as accurate as your tracking. Without a mechanism to connect a customer to the mailer, you are estimating attribution, not measuring it. Each tracking method has tradeoffs.
| Method | How It Works | Limitation |
|---|---|---|
| Unique phone number | A dedicated number on the mailer routes to your main line; calls are logged separately | Requires call tracking software; does not capture walk-ins or web visits |
| Unique landing page or URL | A mailer-specific URL records visits and form submissions | Requires web analytics setup; some recipients type the main URL instead |
| QR code with UTM parameters | Scans are tracked in analytics with campaign source and medium tags | Only captures recipients who scan; does not capture phone or walk-in responses |
| Coupon or redemption code | A code on the mailer is entered at checkout or mentioned by phone | Some customers forget or discard the code; redemption rate understates response |
| CRM source field | Sales staff records how each lead heard about the business | Depends on staff consistency; self-reported data has recall bias |
| "How did you hear about us?" | Asked at intake or checkout | Self-reported; customers may not remember or may attribute to the wrong channel |
| Offer-specific tracking | A mailer-only offer (e.g., a specific service bundle) is tracked by redemption | Only captures customers who use the offer; does not capture full-price responses |
| Call recordings or disposition | Calls are recorded and tagged by source in the CRM | Requires consistent tagging discipline; adds operational overhead |
Attribution window matters. A customer who receives your mailer in March and calls in June may still be attributable to the campaign, but your 30-day measurement window will miss them. Define your window before the campaign, not after.
No tracking method captures 100% of responses. The goal is consistent, repeatable measurement that improves over time, not perfect attribution on the first campaign.
Common Direct-Mail ROI Mistakes
These errors are common enough to address directly. Each one produces a misleading ROI number.
Counting revenue instead of profit. A $5,000 revenue result on a $600 campaign looks like a 900% ROI. If the cost of delivering that service is $4,000, the contribution profit is $1,000 and the actual ROI is 100%. Revenue-based ROI overstates the return for any business with meaningful variable costs.
Ignoring design and tracking costs. A $600 mailing product plus $150 in design and $40 in call tracking is a $690 campaign, not a $600 campaign. Using the lower number inflates ROI and understates CAC.
Counting every sale during the period. If you run a mailer in March and count all March revenue, you are including customers who found you through Google, referrals, or repeat purchases. Only count customers you can attribute to the mailer through a tracked channel.
Using lifetime value without a defined time horizon. LTV is a useful metric, but it requires stated assumptions: contribution margin, retention rate, and measurement period. An LTV number without those inputs is not a calculation, it is a guess.
Assuming every response becomes a customer. Responses are leads. Leads require a sales process. Your close rate is a separate variable that you need to track independently.
Using an industry response rate as a guarantee. Published response rate ranges describe aggregated historical data across different industries, offers, creative quality, and audience fits. They do not predict your campaign's performance.
Measuring too early. Some customers take weeks or months to act after receiving a mailer. Measuring ROI at 14 days may miss a significant portion of attributable customers. Define your attribution window in advance and stick to it.
Double-counting repeat purchases. If a customer acquired in March makes a second purchase in June, that second purchase is retention revenue, not new customer acquisition from the mailer. Count it separately.
Comparing direct-mail reach with digital clicks as though they are identical. A household reached by a physical mailer and a user who clicks a digital ad are different contact events with different attention levels, intent signals, and attribution mechanics. Comparing CPM or CPC across channels without accounting for these differences produces misleading conclusions.
How to Evaluate Repeat Campaigns
Running the same mailing route multiple times is a legitimate strategy, but it should be evaluated on its own merits rather than assumed to produce compounding returns. The relevant questions are:
- How many incremental customers did the second drop produce compared to the first?
- What was the cumulative spend across all drops, and what was the cumulative contribution profit?
- Did the creative or offer change between drops? If so, you cannot isolate the effect of repetition from the effect of the change.
- Were the mailing routes identical? Route consistency is required to measure frequency effects.
- Are you counting the same customers twice? A customer acquired in drop one who purchases again after drop two is a retention event, not a new acquisition.
- What is the contribution profit per incremental customer across the full campaign series?
Repeat campaigns may produce different results than single drops for many reasons, including creative wear-in, seasonal demand, competitive activity, or changes in your offer. Evaluate each drop using the same ROI framework as the first, then compare results across drops to identify trends.
How the TownFavorite ROI Calculator Works
The live calculator at /roi-calculator accepts three user-supplied inputs:
- Mailing product selection (Community Reach, Maximum Reach, or Elite Targeted Reach)
- Average ticket value in dollars
- Close rate as a percentage
- Response rate as a percentage (user-entered, defaults to 1%)
The calculator displays two free outputs without email capture:
- Households reached (fixed by product selection)
- Cost per household (fixed by product selection)
- Estimated responses (households x user-entered response rate)
Full results require email capture and include:
- Estimated new customers (responses x close rate)
- Estimated revenue (customers x ticket value)
- Break-even responses needed
- Estimated ROI percentage
Important limitations of the calculator:
- The calculator estimates revenue, not contribution profit. It uses ticket value multiplied by estimated customers. It does not ask for or apply a contribution margin. The ROI it displays is revenue-based, not profit-based.
- The response rate is user-entered. The calculator does not use market-specific benchmarks or city-specific data. The default of 1% is a starting input, not a prediction.
- The calculator does not include design cost, tracking cost, offer cost, or any other campaign expense beyond the base mailing product cost.
- All outputs are estimates based on user-supplied planning assumptions. They are not forecasts of actual campaign performance.
Because the calculator uses revenue rather than contribution profit, the ROI percentages it displays will be higher than a profit-based calculation for any business with variable costs. Use the formulas in this article to calculate profit-based ROI after your campaign using actual results.
Use the Calculator With Your Own Numbers
The calculator is a planning tool. Enter your own ticket value, close rate, and response rate assumption to model different scenarios before committing to a campaign.
Open the Direct Mail ROI Calculator
Remember that the response rate field accepts any number you choose. Try several values to see how sensitive your break-even point is to changes in response rate. If the break-even threshold requires a response rate that seems implausible given your offer and audience, that is useful information before you spend the money.
Compare Current Mailing Products
Current pricing, household reach, and product details are available at:
TownFavorite Pricing and Products
Browse Current Campaign Markets
Active campaigns across the Birmingham metro area are listed at:
Each market page shows current slot availability, mailing route coverage, and demographic data for that city.
Sources, Assumptions, and Limitations
The product pricing, household reach figures, and product descriptions in this article reflect current TownFavorite product specifications as of the date last verified below. The calculator behavior described in the "How the TownFavorite ROI Calculator Works" section was verified against the live implementation at /roi-calculator.
For USPS EDDM program details, refer to the official USPS Every Door Direct Mail resource at usps.com/business/every-door-direct-mail.htm.
Financial definitions in this article (gross profit, contribution profit, ROAS, ROI, CAC, LTV) follow standard accounting and financial analysis conventions. No external source is required for these definitions, but readers who want additional context may refer to resources from the U.S. Small Business Administration or standard managerial accounting references.
This article does not cite industry response rate benchmarks. Published response rate data varies significantly by source, methodology, audience definition, and time period. Using an industry benchmark as a planning input without verifying its applicability to your specific offer, creative, and market introduces material error into your ROI calculation. The formulas in this article work with any response rate you supply from your own data or planning assumptions.
Explicit limitations:
- All numerical examples in this article are hypothetical and for instructional purposes only.
- No result is guaranteed. Response rates, conversion rates, and revenue per customer depend on your offer, creative quality, audience fit, sales process, tracking discipline, timing, competitive activity, and market conditions.
- The TownFavorite ROI calculator estimates revenue-based ROI, not profit-based ROI. Profit-based ROI requires your contribution margin, which the calculator does not collect.
- Product pricing and household reach figures are subject to change. Verify current specifications at /pricing before making decisions.
Last verified: July 2026.
Questions about campaign availability or product details: Contact TownFavorite.
More from the Blog
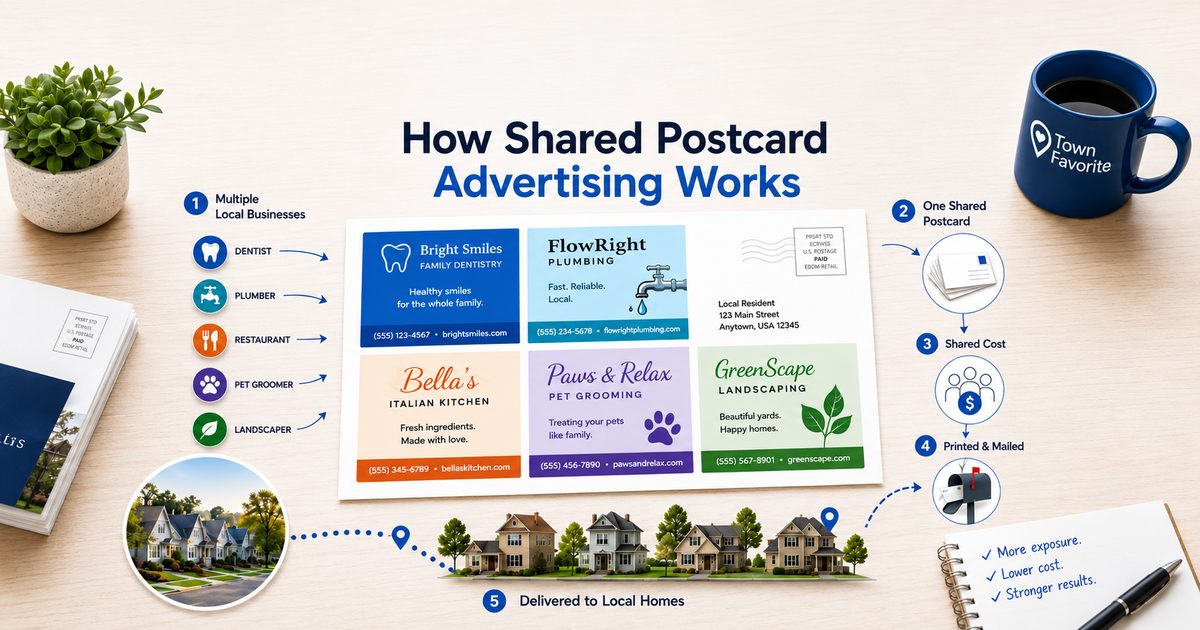
How Community Postcard Mailers Work: Costs, Reach, and Process
TownFavorite community postcard mailers let local businesses share a 9x12 USPS EDDM postcard. Three products. Community Reach ($600/5K homes), Maximum Reach ($850/10K homes), and Elite Targeted Reach ($900/2.5K targeted homes). cover different coverage and demographic goals.

Direct Mail vs. Digital Advertising for Birmingham Businesses
Compare direct mail, Google Search, and paid social for Birmingham businesses using intent, targeting, costs, attribution, and customer-acquisition economics.

Direct Mail Advertising in Calera, AL
Reach 2,800+ Calera households with a shared 9x12 postcard campaign. Calera is a rapidly growing I-65 corridor city in Shelby County with strong demand for home services and local retail.
Get notified when new campaigns launch
Join our mailing list for direct mail campaign updates, pricing, and availability across the Birmingham metro.
No spam. Unsubscribe anytime.